24 well plate map template
Only 24 wells, and every one of them expensive to lose. Free downloads and an online maker, no signup, they open in Excel and Google Sheets.
A 24 well plate usually carries an experiment, not a screen: four conditions by six doses, six transfections by four replicates, a time course laid out by hand. When one well is a whole condition, the map is not paperwork; it is the only record of which well was what, written before the plate goes into the incubator.
Download the plate map template (Excel) Same template as CSV
Download the sample list template (Excel) Same list as CSV
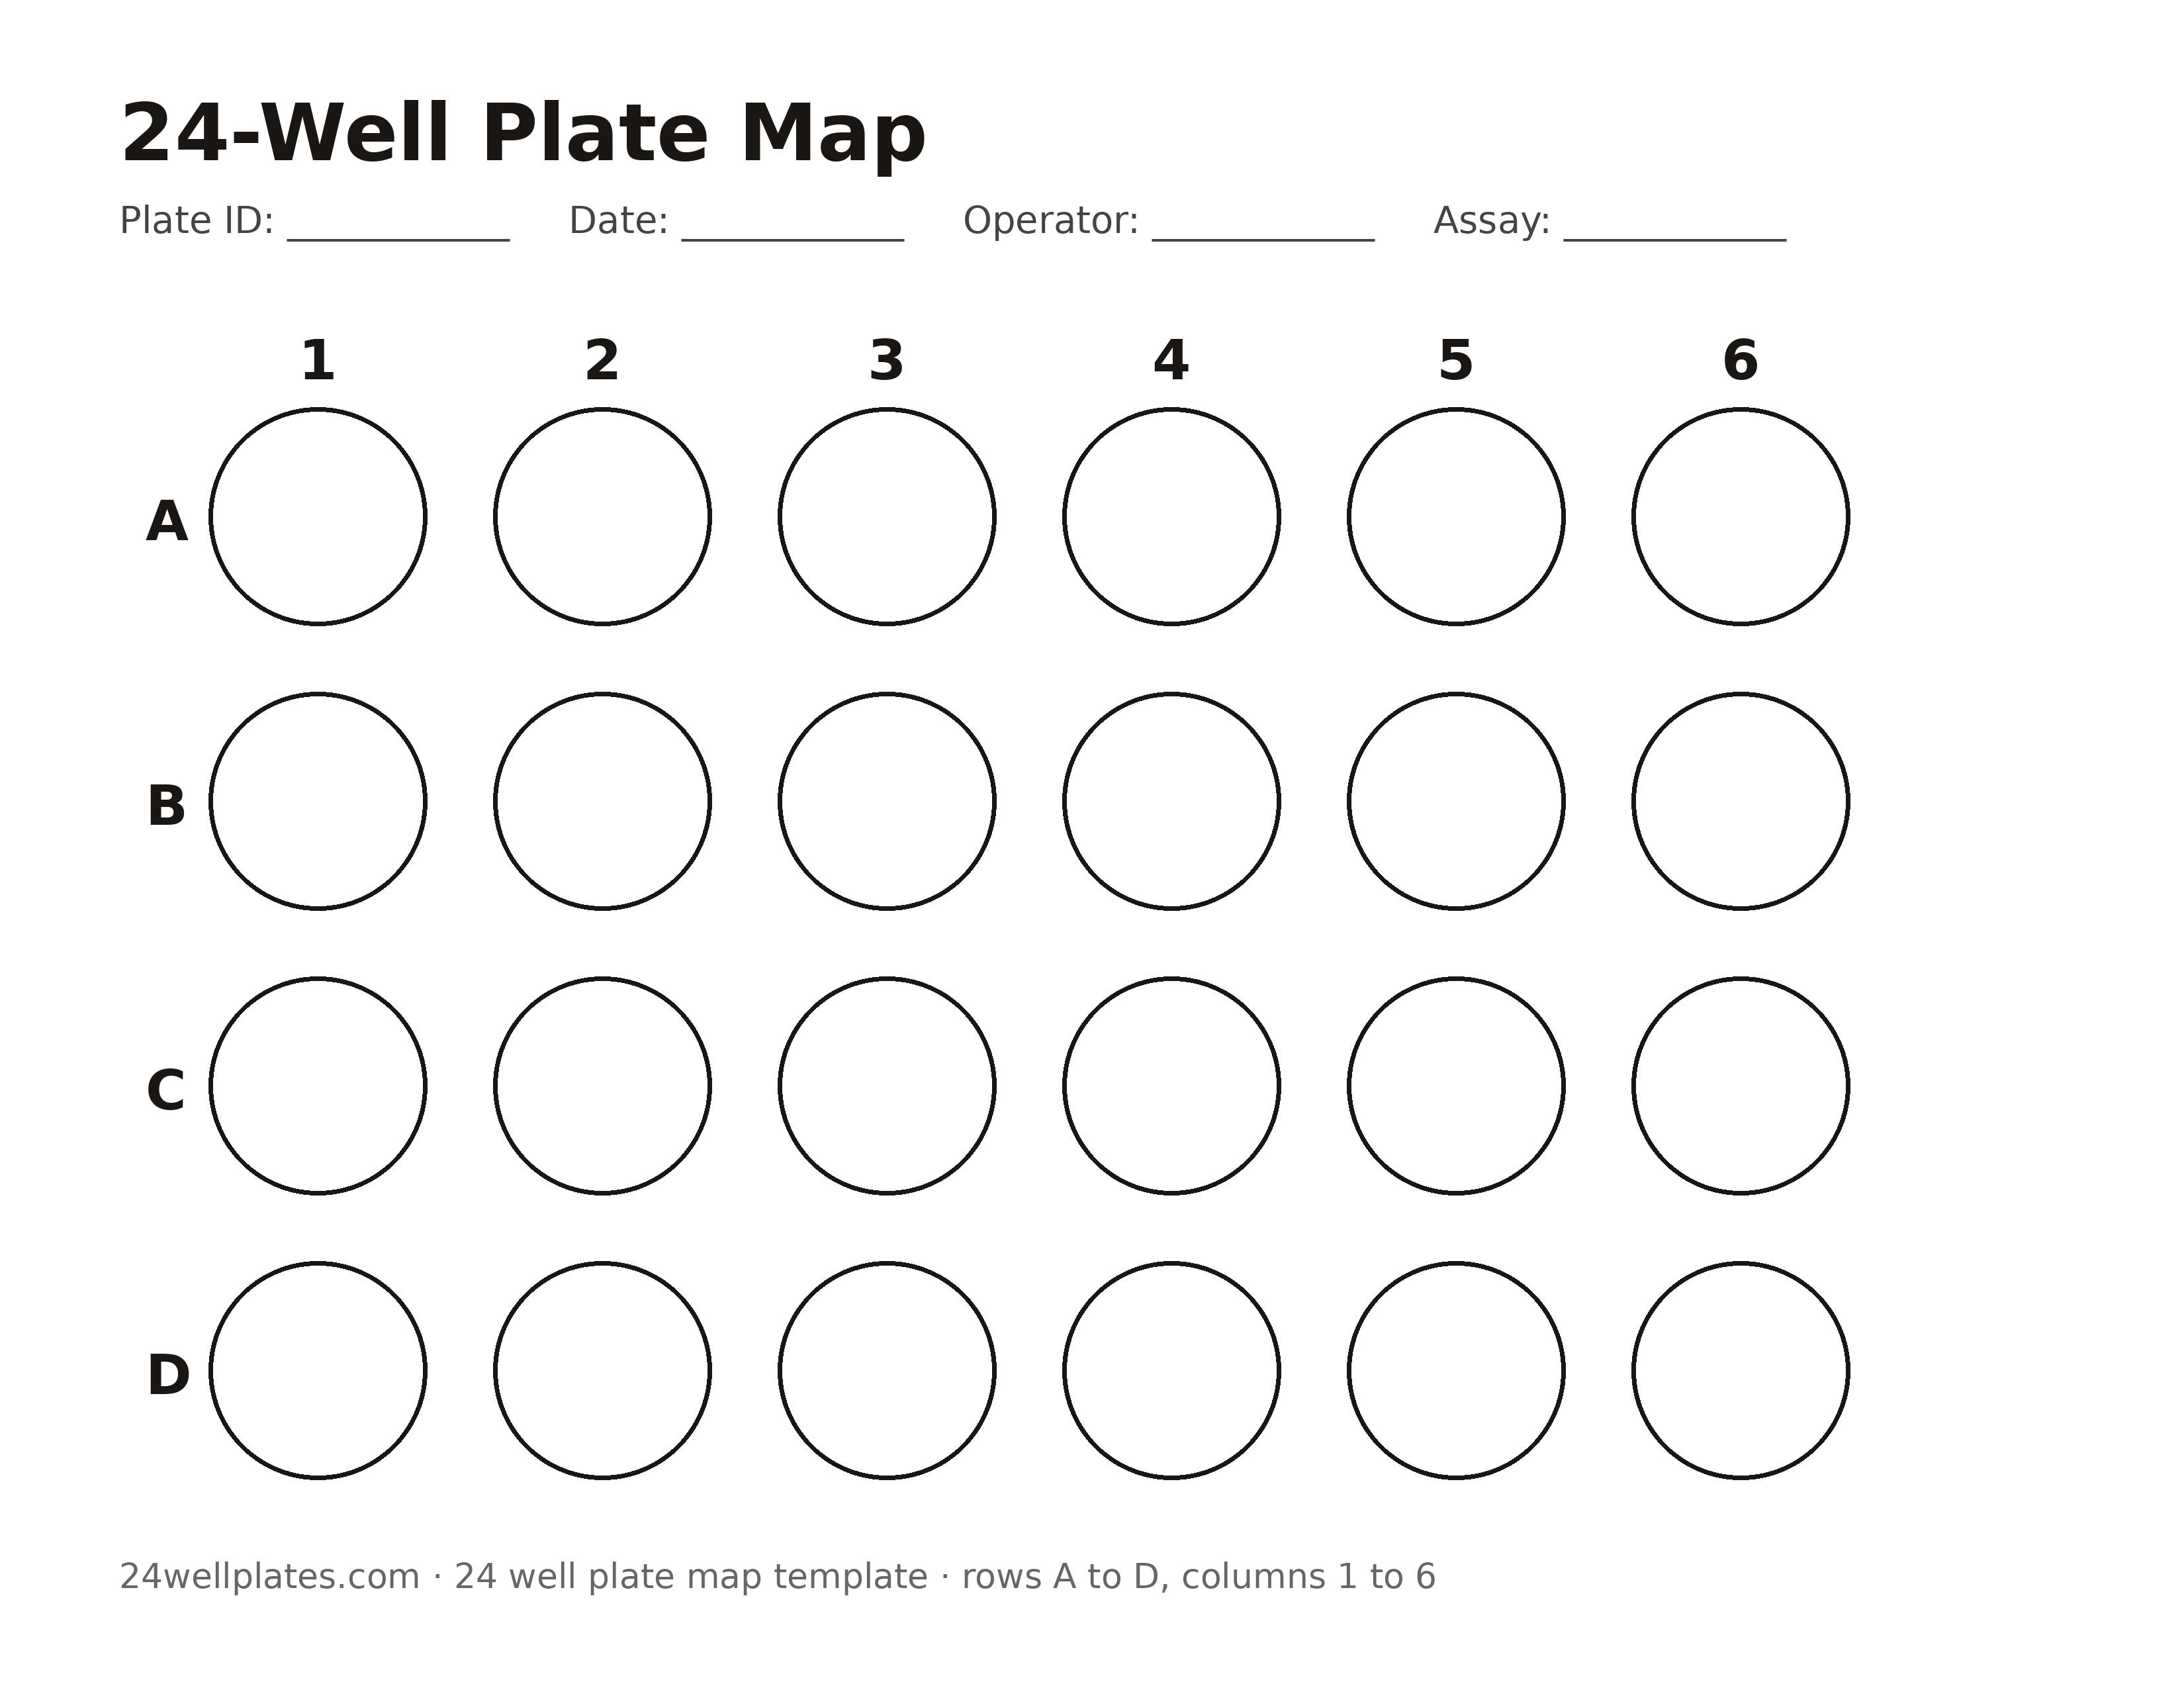
Prefer paper at the bench? Printable plate map (PDF) Same map as a PNG image
Open the online plate map maker Paint wells by group, then export the finished map as Excel or CSV.
Why a map matters when there are only 24 wells
At 384 wells a map protects against transposition at scale. At 24 it protects against something simpler: the layout lives in one person's head, decided at the bench, and a week of culture later nobody can prove which well got which treatment. Dose responses are the classic case, six columns of concentrations across four rows of conditions, pipetted in a pattern that feels obvious while you do it and is unrecoverable an hour later. The map takes two minutes and settles every later argument about what a result means.
How to use the map
The map file is a grid, rows A to D and columns 1 to 6, with header fields for plate ID, date, operator, and assay. Mark the fixed positions first: controls, blanks, and the dose or condition layout, before samples go anywhere. The sample list file is the long form, one row per well for sample ID, contents, concentration, volume, and notes, which pastes cleanly into a lab notebook, a LIMS, or an analysis script. For culture work, note the seeding density and the day of seeding on the map; at 24 wells those two facts explain most odd results later.
Related guides
Common questions
Is the template compatible with Excel and Google Sheets?
Yes. Both files download as Excel workbooks, and CSV versions sit at the same paths with a .csv extension. Excel, Google Sheets, and LibreOffice open either format directly.
How do I lay out a dose response on a 24 well plate?
The natural layouts use the grid dimensions: six concentrations across the columns with four conditions or replicates down the rows, or four doses by six replicates when replication matters more. Put the vehicle control in a fixed column on every plate so runs stay comparable, and write the layout on the map before pipetting, not from memory after.